A futuristic digital workspace with a blue gradient background, featuring a business leader and engineer engaging with a holographic diagram.

How to Explain Technical Debt to Business Leaders

This article shows you how to turn a recurring engineering slowdown into a conversation your leadership will act on. You'll learn how to diagnose what is technical debt in one costly hotspot and put a number on what it drains. Then you'll pick the right analogy for the person across the table and present a fix as an investment with a payback window.

Content authorNikita SivtsovPublished onReading time13 min read

Explain what is technical debt

So you want to answer the question of what is technical debt in a way that a busy executive actually cares about? Start with a story they'll recognize. Picture a startup that ships a payments feature in two weeks by skipping the automated tests. It works. The market rewards the speed. Eighteen months later, a junior dev needs to add one field to that same payment flow, and what should take three days takes three weeks because nobody trusts the code and there's no safety net to catch a mistake.

That gap between three days and three weeks what technical debt means in practice. Ward Cunningham coined the metaphor in 1992 to explain refactoring work on a financial product, and he picked a money word because his audience lived in finance. But his original idea was narrower than most people think. He was describing code shipped with an incomplete understanding of the problem, which you then revise as you learn more.

Cunningham himself pushed back on the loose reading. He said a lot of bloggers confused the metaphor with the idea that you could write code poorly on purpose and call the mess debt. The debt is the distance between what the code assumes and what the business now needs.

And here's the correction that keeps your credibility intact in the room. The interest appears when a feature request reaches a fragile area and forces you to spend extra effort there. An incident has the same effect. So do security requirements and operational changes. Some of that debt is a rational trade, taken on purpose to move fast. Left unmanaged, it steals future delivery capacity and raises your risk of an outage.

Diagnose the costly hotspot

Don't walk into a leadership meeting and say the whole codebase is unhealthy. That claim is unprovable and it sounds like whining. Narrow the discussion to one area that's already tied to something the business cares about this quarter, because that is what technical debt looks like in practice. One hotspot, connected to one priority.

To find it, look at where the friction actually lives:

  • Delivery records that show which areas take longer than their size suggests

  • Incident reviews and post-mortems that keep pointing at the same component

  • Defect patterns and the modules that generate repeat bug reports

  • Ownership gaps, where only one person can safely touch the code

  • Direct feedback from the engineers who dread working in that area

Once you've located the hotspot, ask your team two questions. What originally caused this, and what is the present consequence? Leaders need to know what's slowing or endangering the business right now. To keep the conversation honest, separate debt taken on purpose from debt that crept in, because confusing the two makes every past decision look like a mistake. If you want a neutral second read on which hotspot to name first, Pollume can assess a specific area against your delivery records before you take the case upstairs.

Deliberate technical debt examples

Deliberate debt is the shortcut you took knowingly to hit a date or test an assumption. These technical debt examples are the honest kind:

  • Postponing automated tests to ship a launch feature on time

  • Accepting a manual deployment step instead of building the pipeline

  • Building a limited, hardcoded integration to validate a partnership

A deliberate shortcut isn't reckless on its own. It becomes reckless when nobody wrote down the decision. Record the choice and the trigger for review. Record the owner and the rough repayment cost as well. Deliberate debt is then just a financing decision, the answer to what is technical debt in this case is a conscious trade-off. The question to ask now is whether the original business reason still holds. That two-week payments hack from the intro was defensible in month one. If it's still there in month eighteen, a temporary compromise has quietly become permanent, and that's a different set of technical debt examples entirely.

Accidental technical debt examples

Accidental debt is the kind nobody chose; it is also part of what is technical debt. It grows out of incomplete domain knowledge or requirements that shifted after the code was written. It also arises when dependencies age out of support. An architecture that fit a 5,000-user product can buckle at 500,000. Unclear ownership feeds it too.

The important framing here is that these technical debt examples are not proof of bad engineering. A sound decision made in 2022, under the constraints that existed in 2022, can turn into a costly constraint by 2025 simply because the business grew into a different shape. As Alberto Brandolini, who works in domain-driven design, puts it, the metaphor comes from a deliberate choice to anticipate feedback with a simpler implementation. Reality moves. When you present accidental debt, describe the constraint it creates today and leave the blame out of it. You want the room focused on the fix.

What is technical debt costing

A leader can act on "this feature takes three weeks instead of one, and half of one engineer's sprint every cycle goes to workarounds in this module." To explain what is technical debt, translate the hotspot into time and money with a concrete comparison like that, then back it with a baseline.

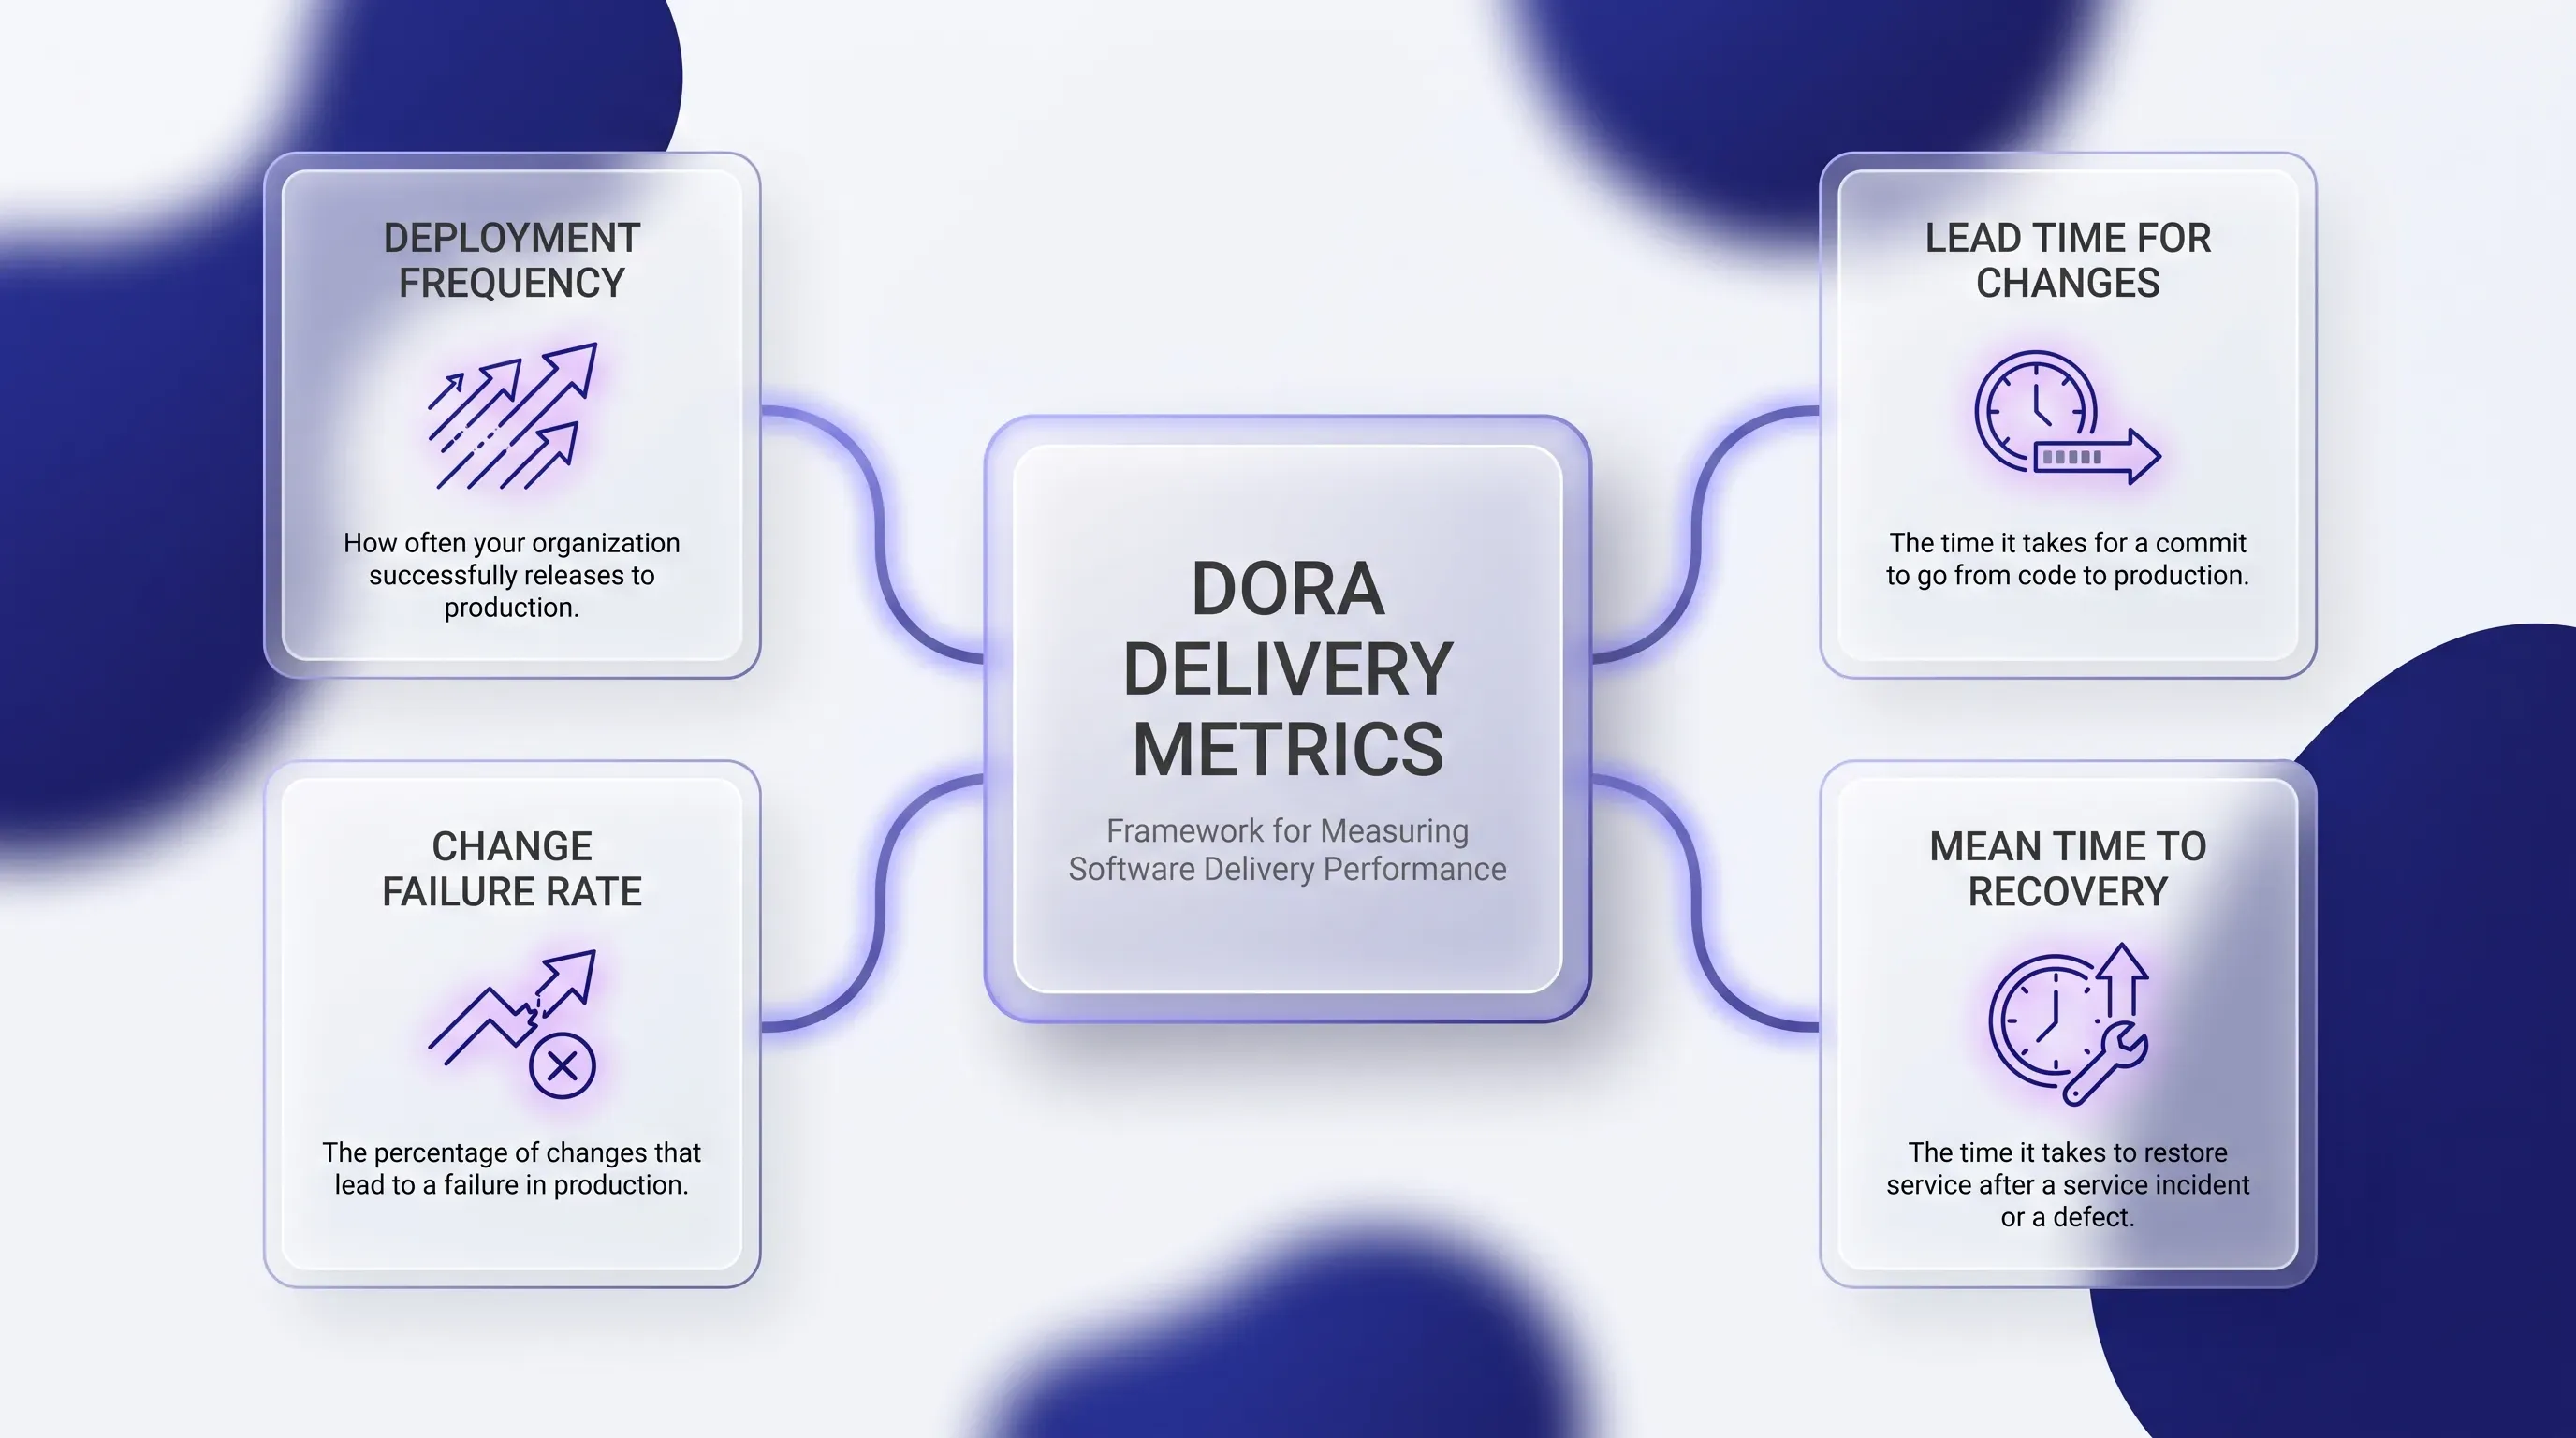
Pull that baseline from the four DORA delivery metrics, developed by Google's DevOps Research and Assessment team, and explain each one in a sentence for a listener who runs delivery but rarely builds an executive case:

Infographic of DORA delivery metrics in a glassmorphic style, featuring a central frosted card and four metric cards with icons.

  • Deployment frequency: how often you ship to production

  • Lead time for changes: how long a committed change takes to reach users

  • Change failure rate: the share of deployments that break something or need a fix

  • Mean time to recovery (MTTR): how long it takes to restore service after a failed change

Add incident frequency and bug rate for the affected module on top. One weak number proves nothing on its own, so resist the urge to hang the whole argument on a single slow metric. The pattern across several of them is what carries weight. For scale, the Stripe Developer Coefficient survey of more than 1,000 developers found engineers spend around 13.5 hours a week on technical debt specifically, roughly a third of engineering capacity. Use that as your industry backdrop. Your evidence is the module in front of you.

Then convert the measures into business language. Explain delayed revenue from features that ship late. Quantify diverted capacity and support costs. Describe service risk or a commitment you'll miss. Label your assumptions and give ranges rather than false precision. When McKinsey surveyed 50 CIOs at billion-dollar firms, they found 10 to 20 percent of the new-product budget gets quietly redirected to servicing debt. A range like that, tied to your own hotspot, lands harder than a fake exact figure.

Choose the right analogy

One analogy, chosen for the person in front of you. Stacking three metaphors together makes you sound like you're reaching, so pick the one that matches how this specific leader decides what is technical debt costs.

For a finance-minded listener, use the credit card. The original shortcut is the principal you borrowed. Every time you change the affected area and pay extra effort to work around the fragile code, that's the minimum payment, the interback charge you keep servicing. You can carry the balance for a while. It just costs you a little on every transaction, forever, until you pay it down.

For a risk-minded leader, use the cracked foundation. The house is standing and people live in it fine. But every new floor you build on top puts more load on the weak spot. Further construction exposes the weakness, which is why you'd reinforce before you add the next feature. Whichever image you use, snap back fast to the measured hotspot so the metaphor supports your evidence instead of replacing it.

Build the investment case

Frame the proposal as buying delivery capacity and reliability, which is how to explain what is technical debt in business terms. It can also control risk. Never frame it as cleaning up code, because that phrasing tells a leader you want to indulge the engineers. An investment case has parts a business person recognizes:

  • The current baseline, in the delivery and reliability numbers you already gathered

  • The bounded scope of the remediation, so it can't sprawl

  • The people and time required

  • The one business measure you expect to move

  • A realistic review or payback window

Then set it against the cost of doing nothing and account for the drag on planned work if the hotspot stays as it is. Avoid guaranteed returns and false precision. What you're offering is a choice with clear consequences. Give the leader options to act now or stage the work across the next few cycles. They can also consciously accept and monitor the risk. Letting them pick keeps the decision theirs, which is exactly how a good business case is supposed to feel. If you'd rather bring numbers you didn't assemble alone, Pollume can help scope the remediation and the time it needs before you commit to a figure.

Plan technical debt reduction

An approved case becomes a plan, and the plan has to compete out in the open with feature work rather than hiding as an unbounded cleanup project. Good technical debt reduction is small and testable when addressing what is technical debt. Measure it against the same baseline you used to win approval. You prioritize by two things: how much business exposure a piece of debt creates, and how much effort it takes to fix. Then you schedule the changes around the workflows that carry the most value.

Define up front how you'll know each fix worked. If you argued the case on lead time and MTTR, you check lead time and MTTR after the change. That closed loop is what turns technical debt reduction from a promise into evidence, and it's what lets you go back and ask for the next slice with a track record behind you.

Technical debt reduction matrix

Draw a two-by-two grid. One axis is cost to fix, low to high. The other is risk if you leave it alone, low to high. Every piece of debt lands in one of four quadrants, and each quadrant gets a different move:
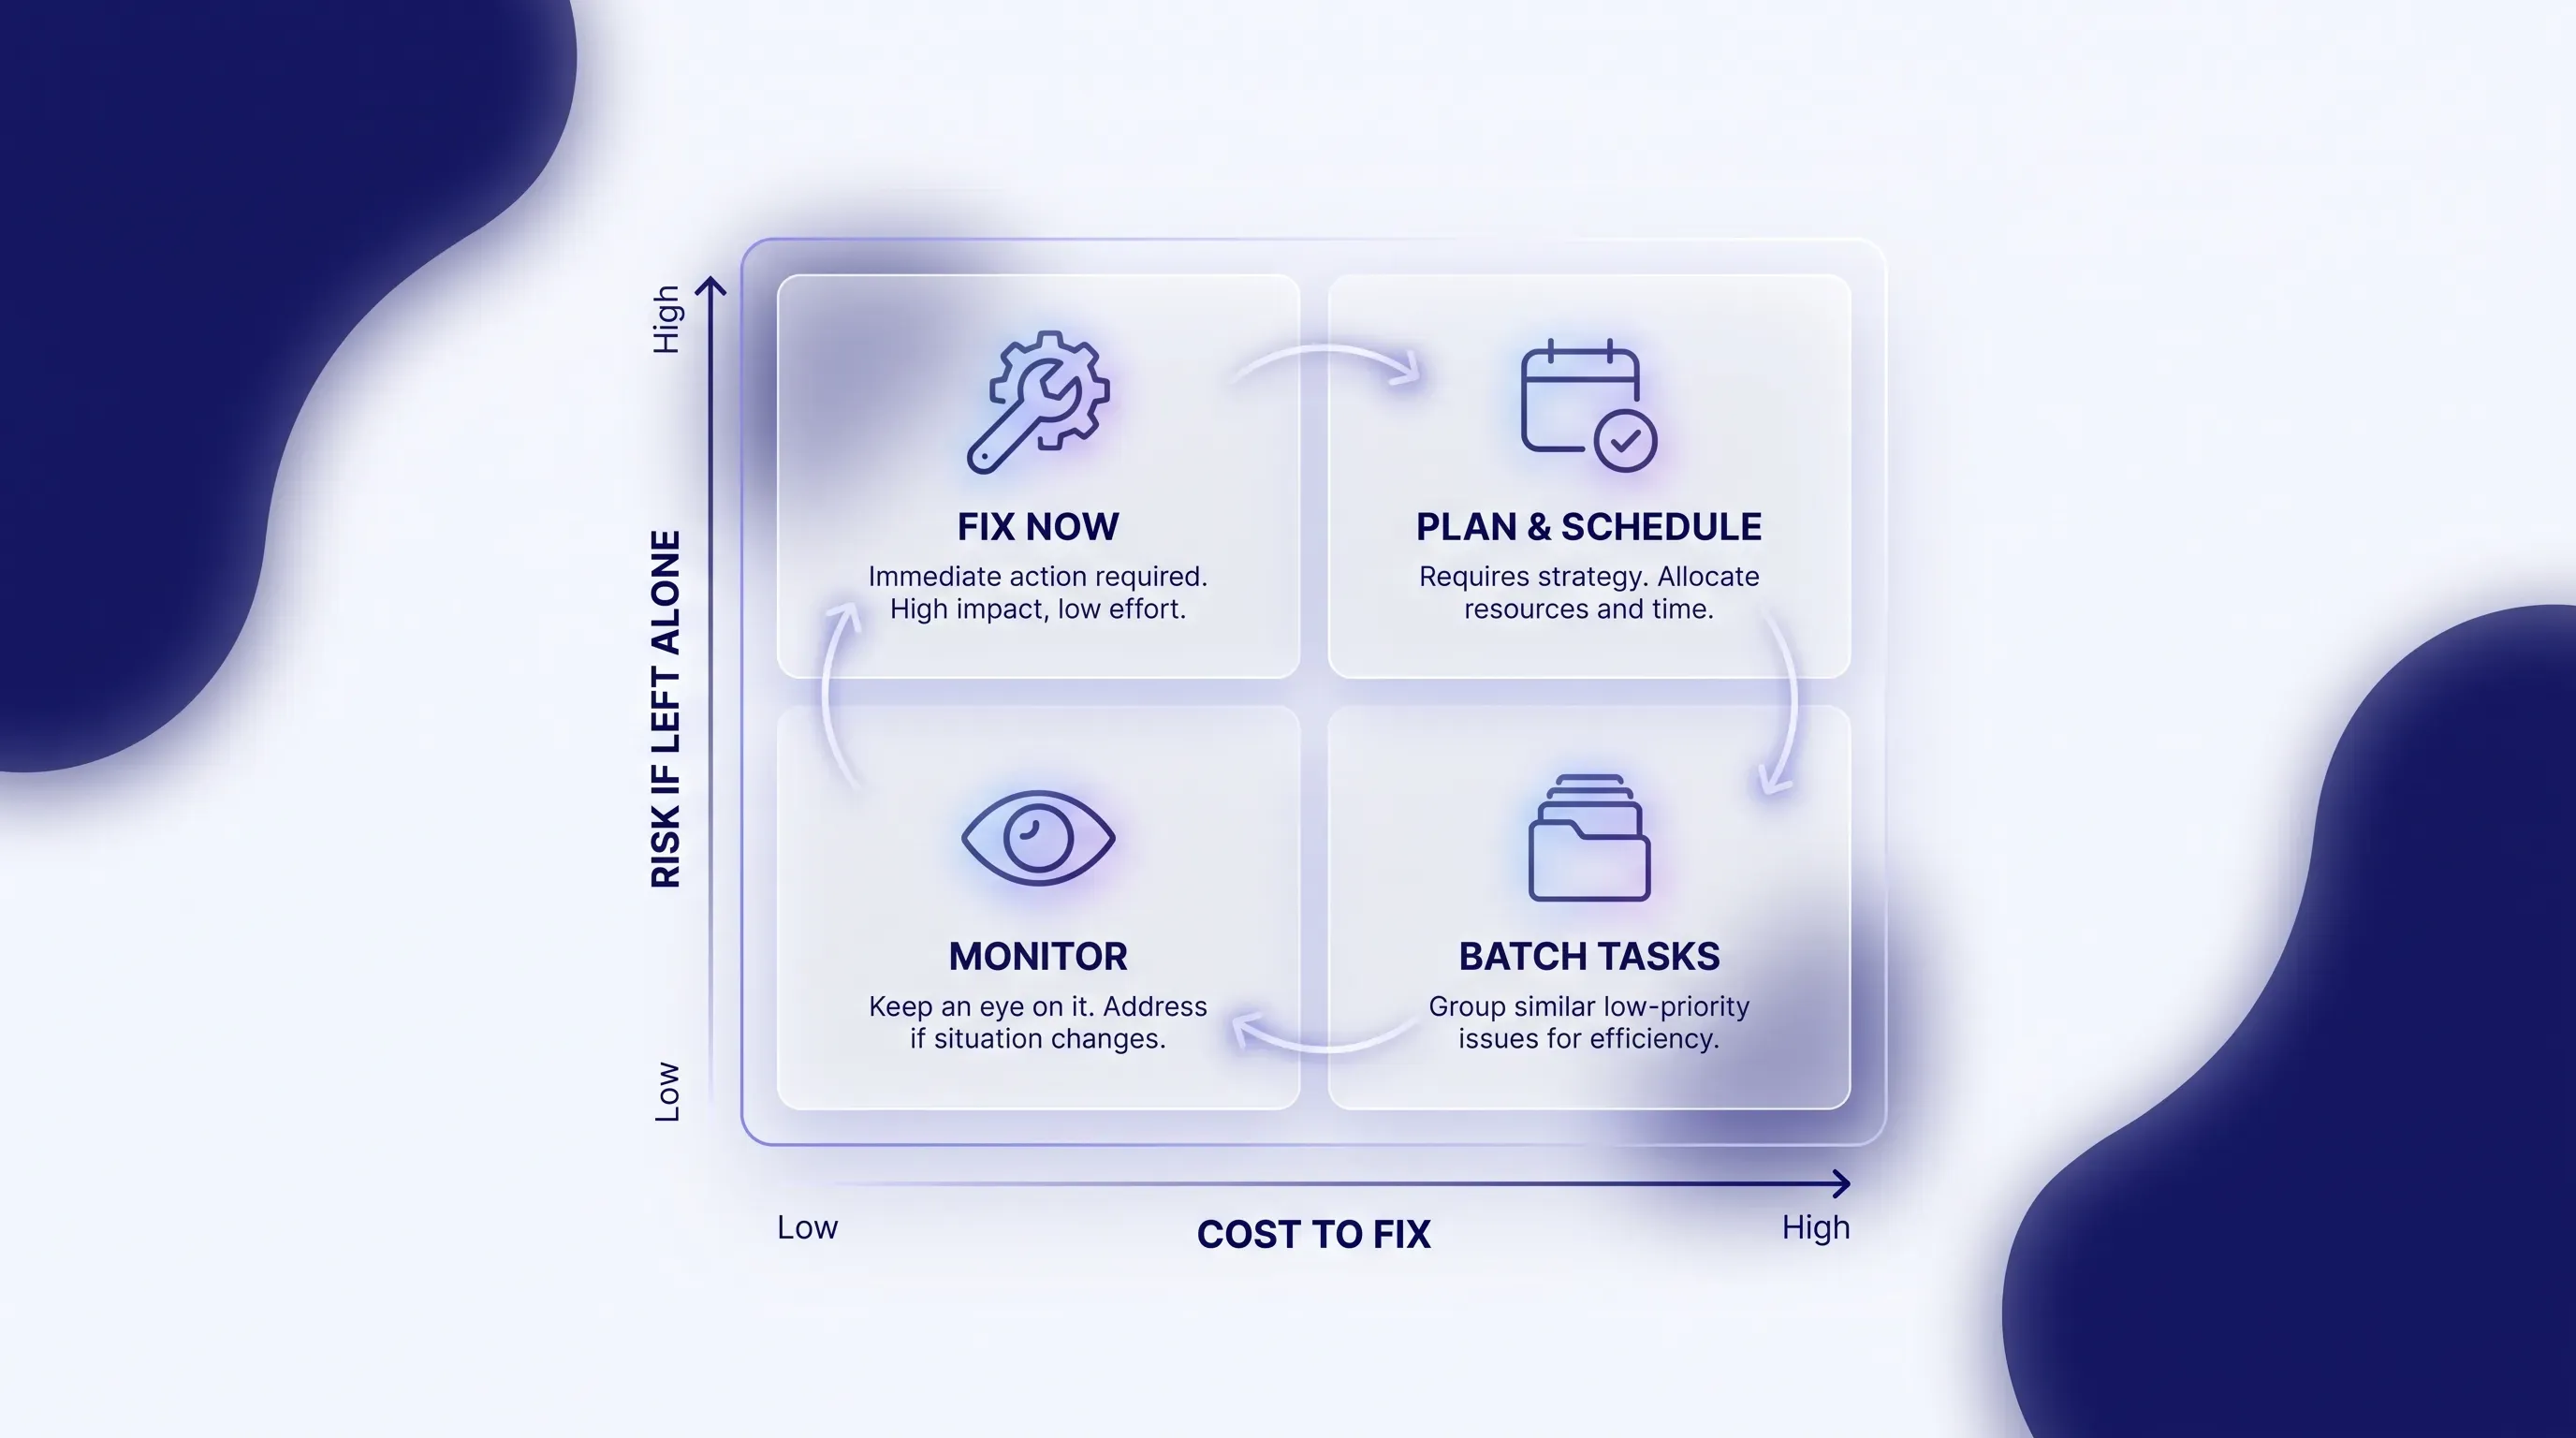
A glassmorphic educational infographic featuring a frosted-glass quadrant matrix mapping 'Cost to Fix' vs. 'Risk if Left Alone' with minimal icons.

  • Low cost, high risk: fix first, this is the cheap insurance

  • High cost, high risk: plan and stage it, break it into fundable slices

  • Low cost, low risk: batch these and do them when convenient

  • High cost, low risk: monitor and consciously accept, don't spend here yet

The part people get wrong is the risk axis. Risk here means delivery delay or incidents. Security exposure and customer impact also count. Dependence on one scarce expert is a risk as well. It does not mean code that offends someone's taste. Keep aesthetics out of it, because the moment a leader smells preference dressed up as risk, your whole technical debt reduction plan loses its footing. The same prioritization can be automated against your repository history if you want the quadrants populated from real data rather than a whiteboard guess.

Sprint allocation plan

Put remediation items in the normal backlog, right beside features. Give each an owner and acceptance criteria. Record its dependencies and an outcome measure. No separate secret track. When debt work sits in the same board as everything else, leadership can see the trade-offs they're actually making.

Rather than prescribing a universal percentage, agree on a recurring capacity policy that leadership can revisit, say a standing allocation you review each quarter. Incremental work is the safer bet for a reason. It limits disruption and keeps the learning risk small, because you find surprises one slice at a time. A one-off cleanup expands as deeper problems surface, and it burns a quarter without ever proving business value. The strangler fig approach that Martin Fowler named is a pattern in which a system changes piece by piece while it stays live. Facebook and Shopify modernized this way. Twitter used the same approach.

Deliver the conversation

When you're finally in the room, run the meeting in a fixed sequence:

  1. Name the business goal the hotspot affects

  2. Show the hotspot and its baseline numbers

  3. Explain the consequence in money or time

  4. Use your one analogy

  5. Present the investment case with its three options

  6. Ask for a specific decision

The most common way this fails is worth naming out loud. You open by saying, "we need to refactor." Or you say, "the architecture is messy." Another opening is "we have technical debt," and you quantify nothing. To a business leader, that sounds like engineers who want to polish code instead of shipping value, and the request dies right there. Lead with the business goal and the number, never with the word refactor.

Keep your implementation detail ready for questions, but out of the opening. When objections come, don't get defensive. Return to the trade-offs and the evidence every time. Keep the options in view. End the meeting by confirming the scope everyone agreed to and the accountable owner. Confirm the review date and the metric that will guide the next decision.

Make risk visible early

One more thing belongs in the conversation, and it's the one leaders underrate most. Ownership concentration is a business continuity problem. If a single engineer is the only person who understands a critical system, their absence or departure can stall changes and slow incident recovery even while the code looks perfectly stable. This is the bus factor, and a study of 133 popular GitHub projects found 46% had a bus factor of 1. Investors and acquirers price that risk whether or not you measured it.

The fix is to make the evidence visible before a crisis forces the funding decision. Put module health and delivery trends into a lightweight dashboard or a recurring portfolio review. Include known debt and accepted risks. Track bus factor as well. When leadership sees these numbers every month, the eventual funding conversation stops being a surprise escalation and becomes the next step in governance everyone already understands. That shared familiarity is what earns you a fast yes when it matters. If you'd rather not build and staff that view alone, Pollume can assess a hotspot and fold the remediation into an ongoing delivery plan. That keeps the answer to what is technical debt in your systems measured and visible before it turns into an emergency, with funding in place.

Explain what is technical debt as a mismatch between earlier assumptions and today’s business needs. State the constraints that shaped the original decision, then show the current delay, incident risk, or support burden. This keeps the discussion focused on a remedy and avoids turning a funding decision into a retrospective judgment.

Delay the feature when the affected debt directly threatens that feature’s delivery date, reliability, or compliance requirement. Compare the remediation effort with the expected delay and risk of building on the weak area. If the link is indirect, stage a small repair alongside planned feature work and review the results.

Estimate the cost by comparing work in the hotspot with a normal baseline. Track extra engineer time, repeat defects, incident recovery, and delayed releases for that module. Convert the recorded hours into loaded labor cost, then present a range that identifies the assumptions behind the estimate rather than claiming an exact figure.

Ask which part of the case failed to meet their decision standard: scope, cost, timing, or expected outcome. Record the accepted risk and its review date, then keep tracking the hotspot’s delivery and reliability measures. Return with updated evidence when the agreed trigger occurs, such as another incident or missed commitment.

Yes, an outside review can test whether the proposed scope and payback assumptions match delivery records. Pollume can assess a named hotspot against repository and delivery evidence before a leadership meeting. Use that review to challenge assumptions, define a bounded repair, and identify the metric that should improve afterward.

Book a call

Book a time that works best for you

You Might Also Like

Discover more insights and articles

A diverse software team interacts with a holographic panel visualizing a 'Rebuild vs Refactor' decision flow in a futuristic workspace.

Control, Speed, or Cost: Picking Rebuild vs Refactor

This article gives you a repeatable way to make a rebuild vs refactor decision for a legacy system that still runs your business but slows every release. It walks through a scoring framework and a money-and-risk matrix, then uses two composite failure cases to explain a hybrid route you can start without betting the whole platform.

A diverse team collaborates in a futuristic digital workspace with a central holographic dashboard and glowing minimalist charts.

What Happens Without application performance monitoring

This article is a diagnostic playbook for tracing a vague "the app feels slow" complaint back to its actual cause. You'll get a working vocabulary and a repeatable checklist. The checklist includes red flags that reveal a team using application performance monitoring without ever finding the bottleneck.

A futuristic digital workspace with three holographic panels labeled ChatGPT, Claude, and Gemini, showcasing glowing icons and charts, as a business team eva…

Speed vs accuracy in your product: ChatGPT vs Claude vs Gemini

This article scores ChatGPT vs Claude vs Gemini against six real business tasks your team runs every week, then breaks down the seat and API costs most comparisons skip. You will finish able to map your top use cases to a concrete tool instead of trusting a demo.

Futuristic digital workspace infographic with holographic workflow panel, human figures collaborating with glowing AI icons, deep blue background.

AI Business Automation Fails at the Workflow, Not the Model

This article reframes AI business automation as a three-layer maturity model and shows you which workflow to rebuild first. You'll get concrete before-and-after examples for support and sales workflows, then a content approval example plus an audit checklist to diagnose exactly where your automation is stuck.