Application scalability needs evidence
Most application scalability work starts with a hunch instead of a number. Traffic climbs and six weeks later you own a distributed system that solves a problem you never measured.
Bigger instances don't fix a missing index. Splitting a service into eleven services adds network hops and a new class of failure. Martin Fowler put the pattern plainly after watching teams try it: "Almost all the cases where I've heard of a system that was built as a microservice system from scratch, it has ended up in serious trouble."
Premature complexity has a price you pay every sprint. Prime Video's video quality analysis team collapsed a distributed pipeline back into a single process and cut infrastructure cost by over 90%, because the orchestration and the S3 round trips between components were the expense. Nothing about that architecture was incompetent for application scalability. It was distributed before the measurement said it needed to be.
Run a readiness diagnostic
Before you spend a quarter on rearchitecting, decide whether the current design is genuinely out of room for application performance. That decision comes from production signals and from how your team is actually shipping.
Check traffic and latency
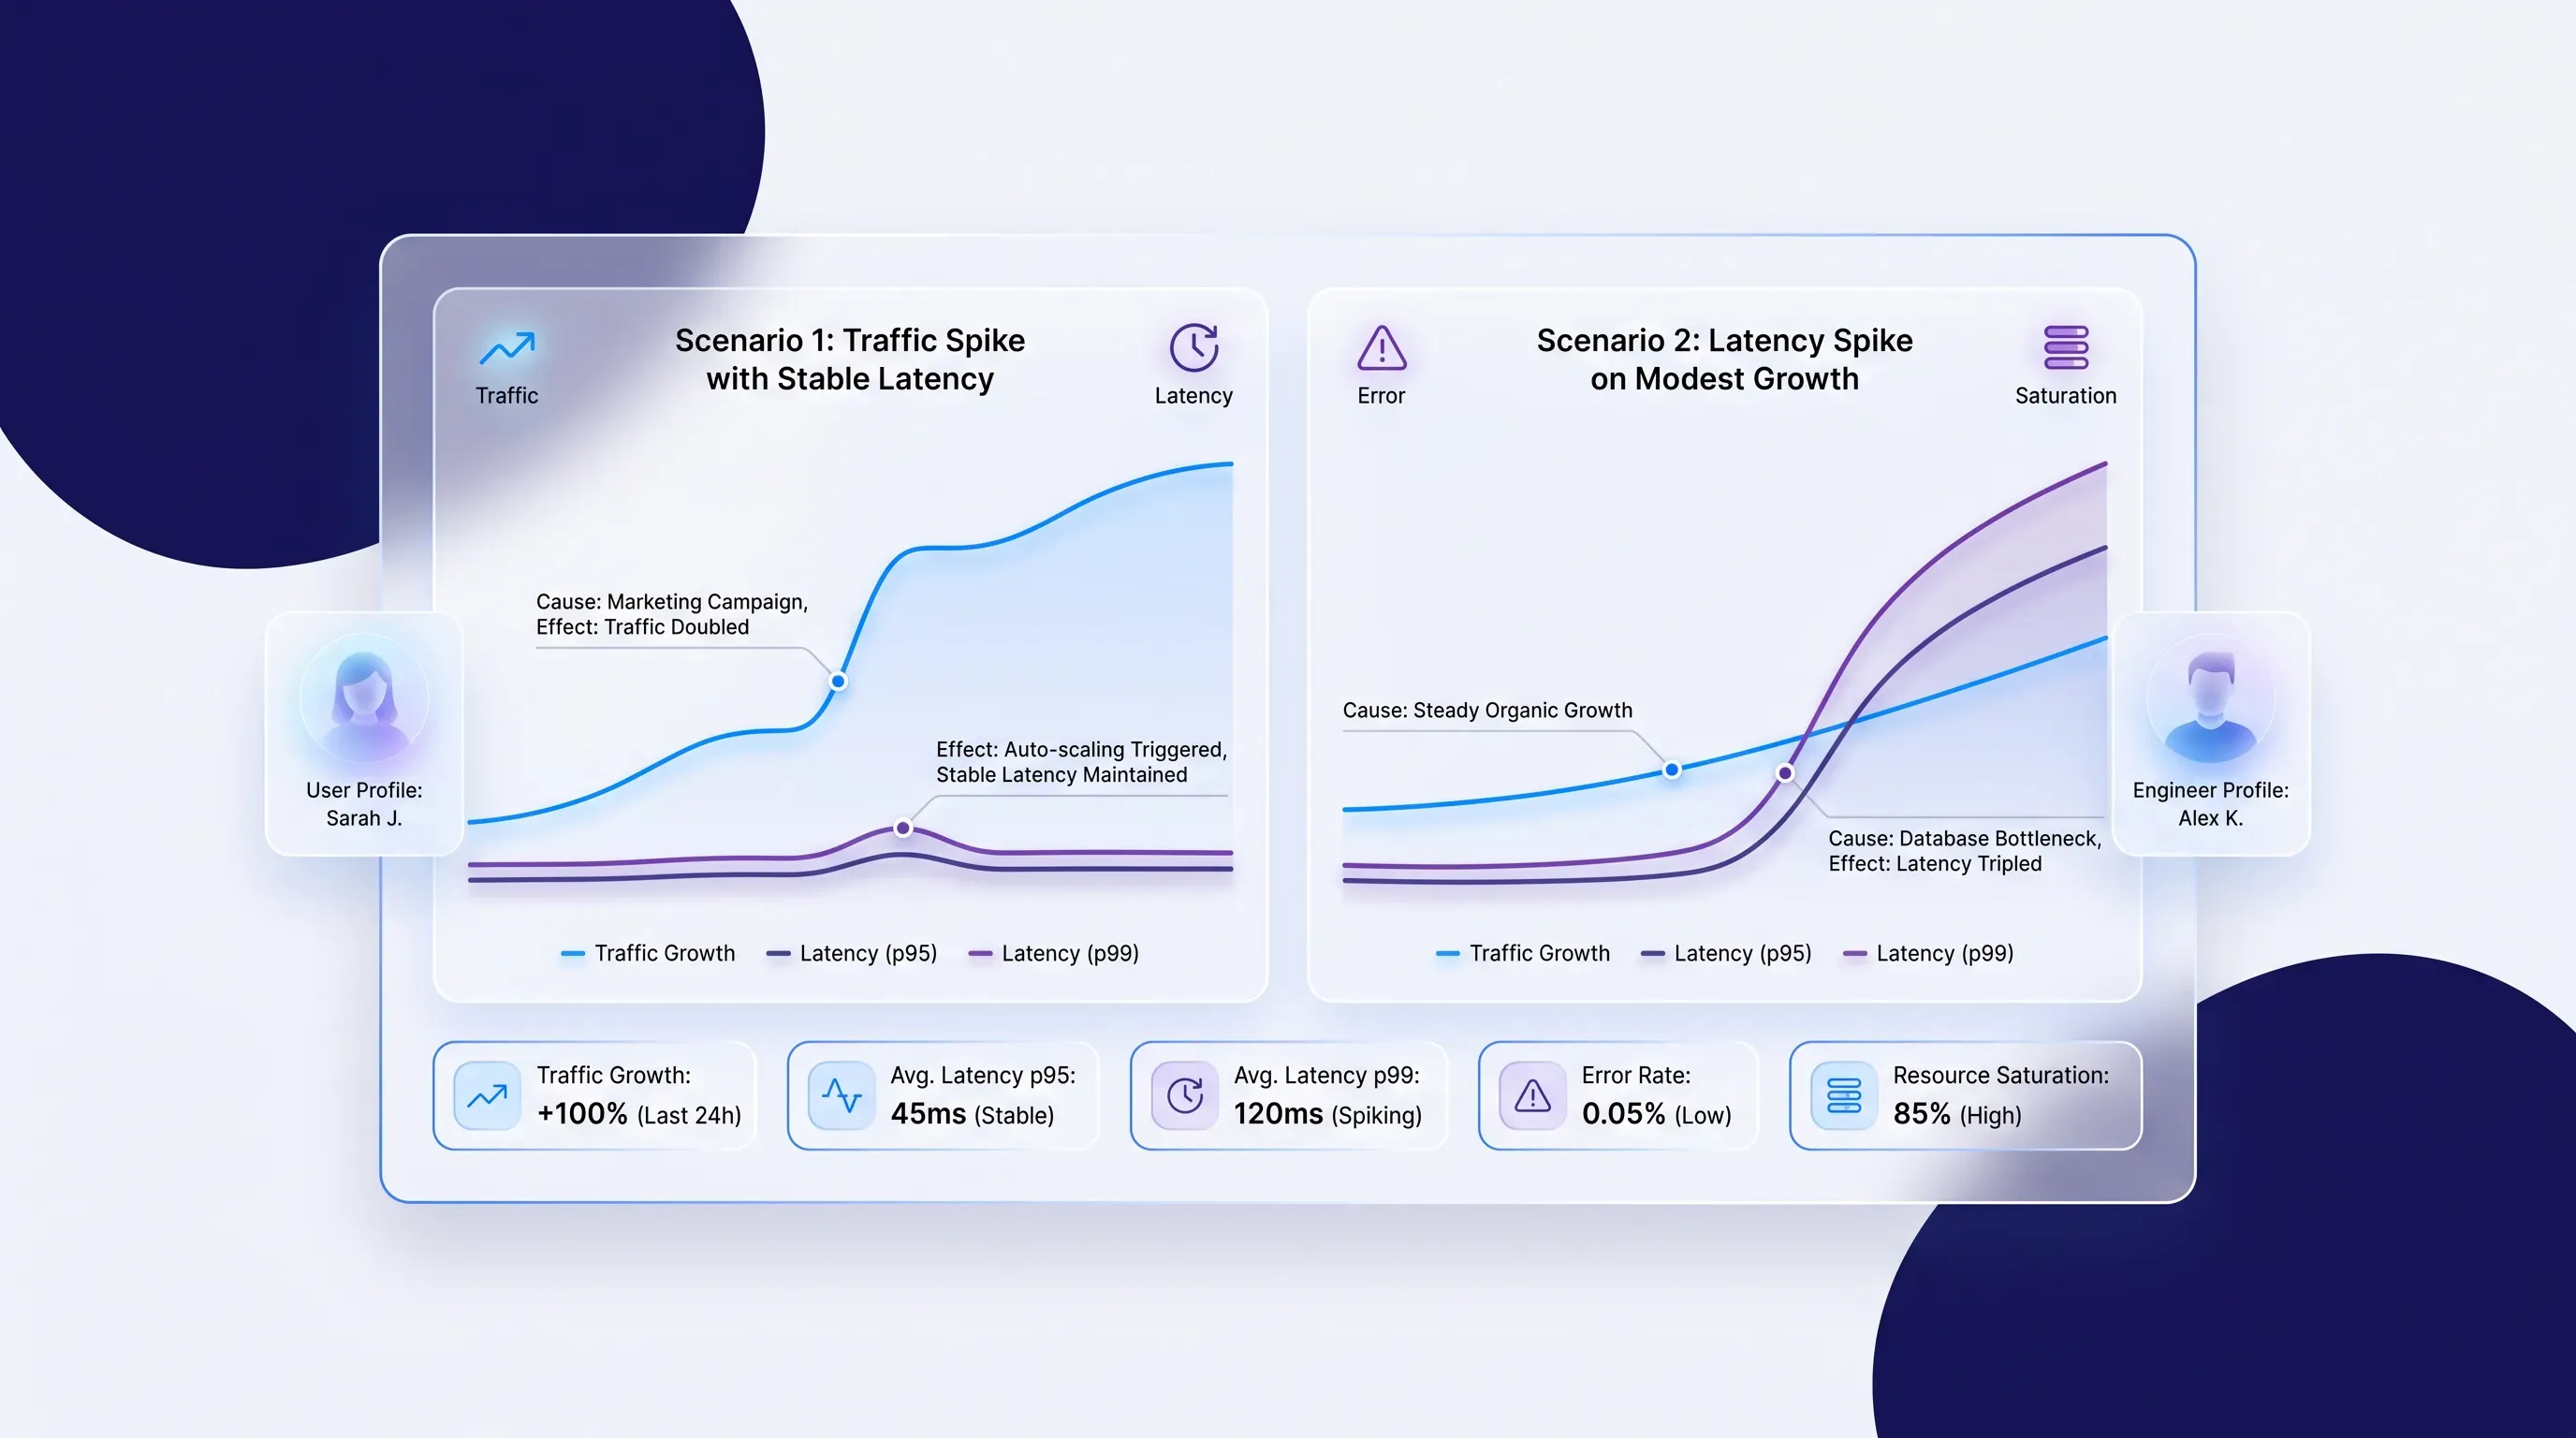
Pull the four signals from Google's Site Reliability Engineering book (latency, traffic, errors, and saturation). Look at them over 90 days on the same chart, and use p95 and p99 rather than averages, because the average hides the requests your users complain about.

Then compare the shape of the curves. If traffic doubled and p95 latency stayed flat, you don't have an application scalability problem yet. If traffic grew 20% and p95 tripled, something specific is saturating, and your job is to find out what.
Watch saturation as a rate of change. A database at 70% CPU that climbs two points a month gives you a year. The same database at 70% that jumped from 40% after last month's release gives you a bug to find.
Check team delivery signals
Architecture for application scalability has to fit the team that operates it. The 2024 DORA State of DevOps report found that only 19% of teams qualify as elite performers who deploy on demand and recover from failed deployments in under an hour. Those are the practices a distributed system assumes you already have.
Ask harder questions about your own numbers. How often do you deploy? How many people have to be in a room to release a change? What fraction of last quarter went to incidents rather than product work?
Martin Fowler's prerequisites for microservices are unforgiving on this point: rapid provisioning and rapid deployment come before service extraction. If eight engineers own one deployable and every release needs coordination, adding twelve deployables multiplies the coordination instead of removing it. Operational capacity is the constraint that scalable architecture discussions skip most often.
Test scalable architecture assumptions
Make every proposed investment answer four questions in writing before anyone opens an editor:
-
Which measured constraint does this remove? Name the metric and the current value.
-
What effect do you expect, in numbers? "p95 checkout latency from 1.8s to under 600ms at current traffic."
-
How will you validate it? A load test at 3x current peak and a canary.
-
What's the simpler alternative you rejected, and why? An index or a cache.
If a proposal can't fill in the first line, it's a preference. Run your current roadmap through those four questions before you read the rest of this, and see how many items survive.
Measure before scaling
Instrument first, in three layers. Structured logs with a request ID and metrics for the golden signals per endpoint. Distributed traces break a request into its dependency timings for application scalability. The trace is what tells you that 1.4 seconds of a 1.6-second response is one external payment API call, which no amount of extra application capacity will fix.
Then load test against something resembling production. Copy the read/write mix and the data volume, because a query plan on 10,000 rows and the same query on 40 million rows are different queries. Ramp until something breaks and record what broke first.
The point of the exercise is a baseline and a named limiting resource. One of these is your constraint at any given moment:
-
Application code: CPU pegged on serialization, template rendering, or a hot loop, with the database idle
-
Database work: query time dominating trace spans, lock waits, or a connection pool with clients queuing
-
Memory: garbage collection pauses tracking your latency spikes, or a container hitting its limit and restarting
-
Network and external calls: bandwidth ceilings, DNS, or a third-party dependency setting your floor
Fix the first one. Then measure again, because the application performance constraint moves the moment you relieve it.
Fix the query layer
The database is where application performance goes to die, and it's also the cheapest place to win. Turn on pg_stat_statements and sort by total_exec_time descending to find the queries burning the most wall-clock time across all calls. The worst offender is frequently a fast query called 40,000 times per minute.
Work through the usual suspects in order. Missing indexes on filter and join columns. Sequential scans on tables past a few hundred thousand rows. Transactions held open across an external API call, which turns one slow request into a lock convoy.
Then hunt N+1 patterns, which your Object-Relational Mapper (ORM) generates cheerfully and silently. A list page that loads 50 records and then issues 50 follow-up queries for each record's author is 51 round trips where a join or an eager load gives you one or two. Batch loading is the fix when the relationship is too wide to join, so you collect the identifiers and issue a single IN query.
Size the connection pool from evidence. Postgres forks a process per connection consuming 5+ MB of RAM plus context-switching overhead, so more connections past a point makes throughput worse. Track active connections and wait time together. If wait time is high while active connections sit well below the cap, your queries are slowing application performance.
Reduce repeated work
Caching is the highest-leverage move available before you touch topology, because it removes work instead of buying capacity to absorb it. Redis handles 180,000 SET operations per second with a p50 of 0.143ms on a single node in Redis's own benchmark, which is why a cached read costs roughly nothing next to a join.
Cache the reads that repeat far more often than they are written. Memcached is fine if you only need a key-value cache. Redis earns its place when you want sorted sets or persistence.
Every cache entry needs two rules written down: when it expires and what invalidates it. A time-to-live alone gives you stale data for the length of the window. An invalidation hook alone gives you an unbounded cache and a memory incident at 3 a.m. Write both, and name the owner of each key pattern.
Then get mutable state out of the process. Sessions in local memory force sticky sessions, and sticky sessions mean an instance restart logs users out and your load balancer distributes badly under uneven load. Move sessions to Redis or signed tokens and push uploads to object storage. Once any request can hit any instance, horizontal scaling for application scalability becomes a configuration change instead of a project.
Scale application capacity
Vertical scaling for application scalability is underrated because it's boring. Doubling the instance size is a config change and a restart that buys real headroom. AWS will rent you a single instance with 1,920 vCPUs and 32 TiB of memory, so "we outgrew one machine" is a claim that needs evidence behind it.
Scale up until one of two things is true: the cost curve turns against you, or you need redundancy that a single instance can't give. Redundancy is the better reason. One instance is one deploy away from downtime regardless of how big it is.
Once you go horizontal, put a load balancer in front. NGINX if you want to run it yourself, AWS Elastic Load Balancing or Azure Load Balancer if you'd rather not. Health checks matter more than the choice of balancer, because a balancer routing traffic to a half-dead instance is worse than no balancer.
For automatic capacity, Kubernetes Horizontal Pod Autoscaler or a managed autoscaling group both work, but tune the timing. The HPA default scale-down stabilization window is 300 seconds while scale-up has no stabilization at all, which is the right asymmetry for spiky traffic and the wrong one for a batch workload that thrashes. Scale on the metric that reflects your constraint, so queue depth for workers and request concurrency for web tiers, rather than CPU by default.
Relieve the data tier
Application instances are cheap to add. The database is not, which is why the data tier is where a scalable architecture either holds or falls over.
Read replicas come first, and only when reads are what's constraining the primary. Notion routes 90% of read traffic to replicas to keep pressure off the primary. The cost is replication lag, so every read path has to declare whether it tolerates data a few hundred milliseconds old. A user reading their own just-submitted comment does not.
Sharding is last, and only when one database provably cannot meet measured demand. Notion sharded into 480 logical shards across 32 physical databases, keyed on workspace ID, after transaction ID wraparound threatened to stop writes entirely. That's what a forcing function looks like. They also picked 480 because it divides cleanly by many numbers, which let them later grow to 96 physical hosts without redistributing everything.
Some workloads resist distribution, and it's worth knowing which before you commit:
-
Cross-entity transactions, because a two-phase commit across shards trades a database guarantee for application code you now maintain
-
Joins across the shard key, which turn into scatter-gather queries bounded by your slowest shard
-
Strong consistency requirements, since replicas and shards both introduce windows where reads disagree
-
Uneven access, where one tenant is 40% of your traffic and lands on one shard anyway
If your access pattern has a natural partition key like tenant or workspace, sharding works well for application scalability. If it doesn't, you're building a distributed join engine, and that project is much larger than it looks.
Two scaling outcomes
Timing is the whole variable. The same scalable architecture that saves one team destroys another team's velocity, and the difference is whether a measured constraint existed when they built it.
Complexity at 500 users
Segment split its monolith into microservices roughly a year after launch, then spent three years adding to them. Alexandra Noonan, the engineer who led the move back, described where it ended up: "if they are implemented incorrectly or used as a Band-Aid without addressing some of the root flaws in your system, you'll find yourself no longer to make any new product development because you'll be drowning in the complexity."
A team at 500 daily active users repeating that pattern loses in predictable ways. Every feature crosses service boundaries, so a one-day change becomes three coordinated deploys. A trace goes missing between two services and debugging turns into archaeology. On-call now covers eleven deployables, each with its own pipeline and dashboards, while the actual request volume would fit comfortably on one modest instance. The velocity cost is immediate and the capacity benefit is zero, because there was no application scalability problem to solve.
Focus past 100k users
The opposite path is unglamorous and works. Find the top three consumers of wall-clock time in application performance and fix them. Indexing the columns your hot queries filter on. Batching the N+1 that your list endpoints generate. Caching the reads that repeat thousands of times an hour.
Systems well past 100,000 users run this way today. Stack Overflow serves more than 6,000 requests per second from a monolith on nine web servers and a single primary SQL Server with a hot standby. Shopify's Ruby monolith peaked at more than 117 million requests per minute on app servers during Black Friday-Cyber Monday.
Neither example proves your system will scale the same way. Their access patterns and data models are specific to them. What they do prove is that "we've outgrown this architecture" is a claim requiring measurement, because the ceiling of a well-tuned single deployable sits far higher than most roadmaps for scalable architecture assume.
Improve application scalability sequentially
Do this in order, and stop as soon as the numbers stop justifying the next step. Measure and name the constraint. Fix the query layer. Cache the repeated reads. Scale vertically while it's still cheap. Move state out of process. Add instances behind a load balancer. Only then distribute data or extract a service.
Pollume builds and hosts web and full-stack applications for startups and growing companies, which means we spend a lot of time in codebases where cost and latency climbed before anyone profiled anything. If you want a bottleneck assessment and a delivery plan that improves application scalability without a rewrite you don't need, get in touch.