When the app feels slow
A support message lands in your inbox: "Checkout feels slow on Tuesdays." That's it. There is no error code or screenshot. There is no stack trace. And application performance monitoring exists precisely for moments like this, when a complaint is real but you have no map from the symptom to the source. You own the product. You sit between the customer who's frustrated and the small engineering team who'll ask you what, exactly, is broken.
Here's what makes it maddening. You check the status page. Everything is green. The servers are up, the deploy went fine, and yet a paying customer just told you the most important flow in your app drags on a specific day of the week. The dashboard says nothing is wrong. The customer says something is. Both are telling the truth.
So this is a detective story, and it has a recurring twist that shows up in almost every slow app ever built. By the end, you'll be able to trace that Tuesday checkout complaint backward to its source yourself, before you ever loop in an engineer. The goal is to arrive at the next standup with a sharp hypothesis instead of "can someone look into this."
Why server up misses the problem
The first trap is assuming "up" and "fast" are the same thing. They aren't. An app is up when the server answers the request. An app is fast when it answers quickly enough that the person waiting doesn't feel the delay. Those are two different promises, and a status page only checks the first one.
Think about what happens during that Tuesday checkout. The request goes out to the server, where the app does its work, and four seconds later the confirmation appears. No error fired. Nothing crashed. From the server's point of view, the request succeeded. From the customer's point of view, the app broke, because four seconds of staring at a spinner during payment feels like the site is dying. Response time, which is just how long a request takes from click to answer, is the number the customer actually feels. The green checkmark never sees it.
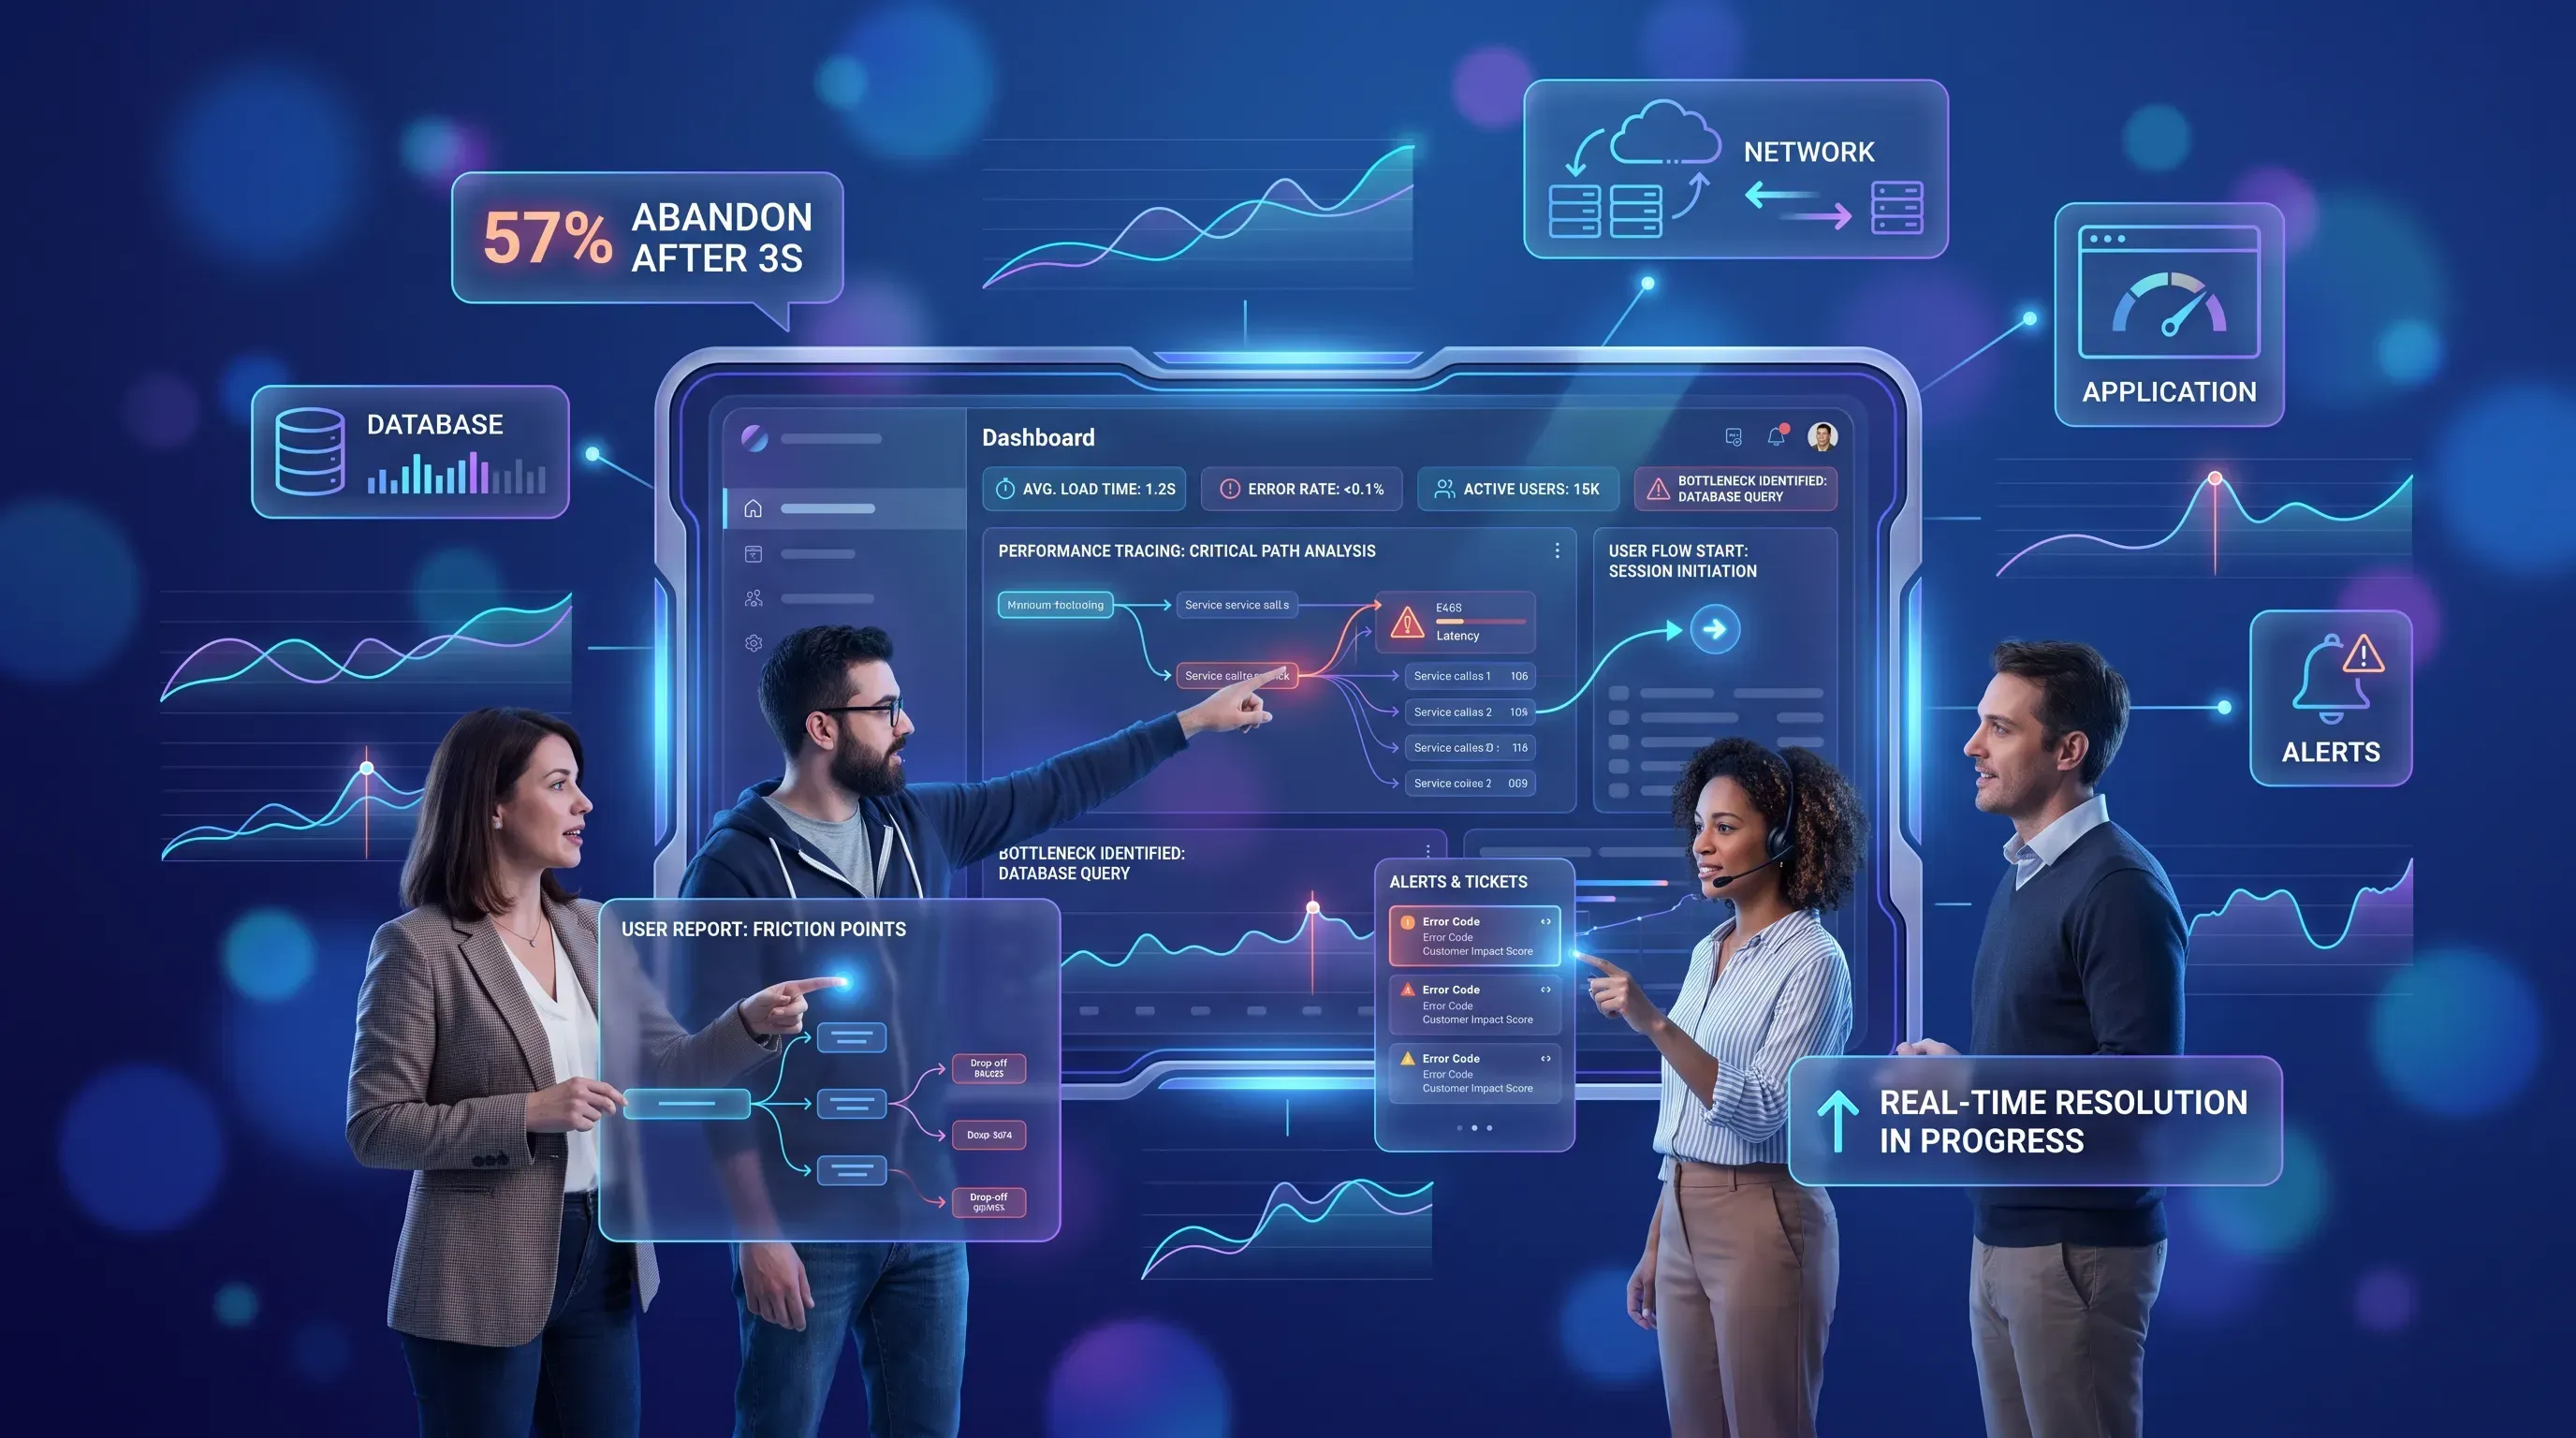
This matters more than it sounds. According to a study cited by Contentsquare, 57% of shoppers abandon a page that takes more than three seconds to load, and a mere 0.1-second improvement in load time can lift ecommerce conversions by 8.4%. One study found a two-second delay pushes the cart abandonment rate to 87%. None of that pain registers as an error. It registers as silence, as people leaving.
Application performance monitoring that only tracks up-or-down status is like a doctor confirming a patient is alive while ignoring that they're in agony. Technically accurate. Useless to the person suffering. To find the Tuesday bottleneck, you need to see past "it responded" and into "how long it took, and for whom." That's where the real numbers live.
Reading the metrics that matter
Application performance monitoring surfaces a handful of numbers, and reading the right ones is what separates the founder who finds the bottleneck from the one who stares at pretty graphs. You don't need to know how any of these are calculated. You need to know what each one is telling you.
The single most important lesson comes first, before any definition: averages lie, and percentiles tell the truth about real user pain. Hold onto that. It's the reason your dashboard looked fine while a customer was quitting mid-purchase. Everything below points back to diagnosing that one Tuesday checkout complaint.
Response time and p95 p99
Response time is how long a single request takes. Simple enough. The problem is what happens when you average it across thousands of requests, because the average hides the exact people you're trying to find.
Picture ten checkout requests, nine of them fast and one painfully slow. Web-alert.io works a similar example: response times of 50, 55, 60, 60, 62, 65, 70, 72, 80, and 2000 milliseconds. The average comes out to 257 milliseconds, which looks acceptable. But that number "describes no actual request." It's higher than 90% of the requests and eight times lower than the slowest one. One customer waited two full seconds, and the average erased them completely.
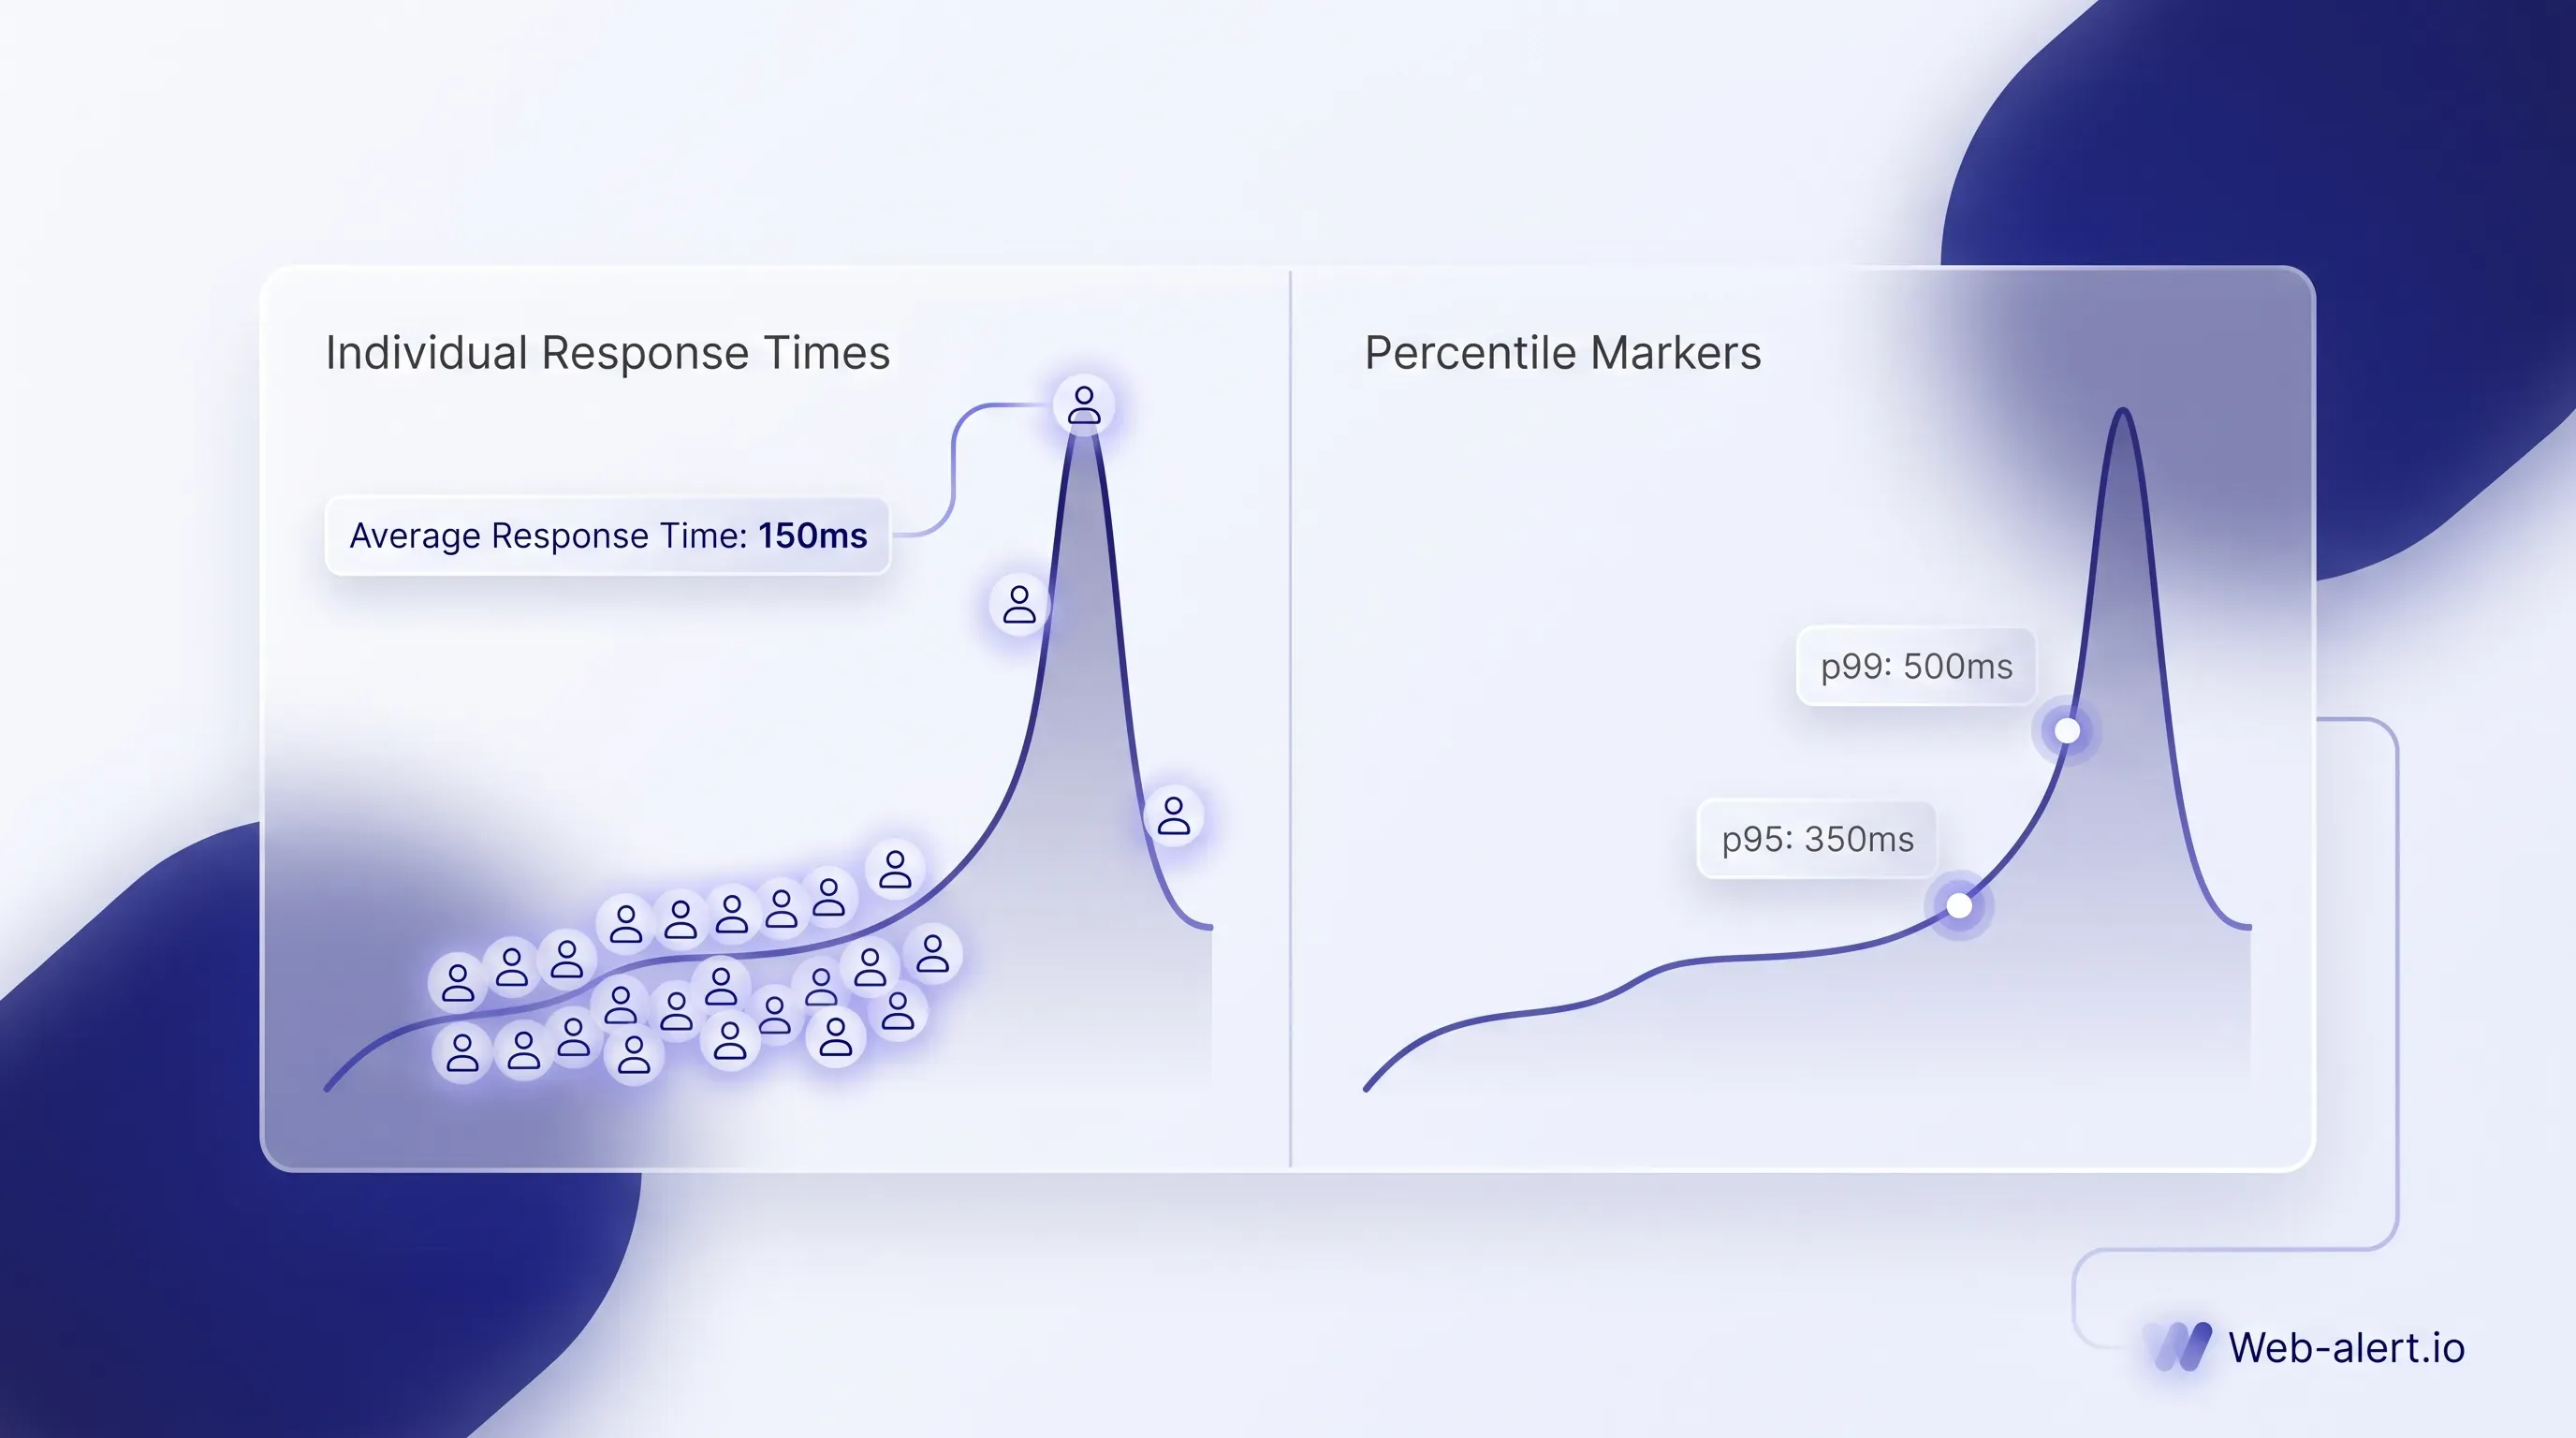
Percentiles fix this by refusing to blend everyone together. Two you'll hear constantly:
-
p95: 1 in 20 users waited longer than this number. It's your early warning that some real users are hurting.
-
p99: 1 in 100 users waited longer than this. This is where abandoned carts and churn actually live.
As the engineering blog DigitalCosmonot puts it, if 99 requests complete in 50ms and one takes 5 seconds, the average still looks fine, "but for some users, the system feels broken." That's your Tuesday complaint in one sentence. The average response time on checkout looked healthy. The p99 was several seconds. The pain was real and invisible at the same time, because nobody was looking at the tail.
The exact phrase to bring to your next standup: "What's our p95 and p99 on the checkout endpoint?" If the answer is "we only track the average," you've already found your first red flag.
Throughput, error rates and Apdex
Three supporting numbers round out the picture without drowning you.
Throughput is how many requests your app handles over a stretch of time. A sudden spike or drop is a signal. Traffic climbing on Tuesdays while response time holds steady means one thing. Traffic flat while response time climbs means something else entirely.
Error rate is the share of requests that fail outright. This is the up-or-down view, and it's worth watching, but remember the whole point of this chase: your Tuesday problem never threw an error. A low error rate can sit right next to a miserable customer experience.
Apdex bundles the felt experience into one score between 0 and 1. It assigns a response-time category according to a threshold you set, with a tolerating category between satisfaction and frustration. As New Relic's documentation explains, a request faster than the threshold T is satisfied, between T and 4T it's tolerating, and beyond 4T or with a server error it's frustrated. A score of 1 means everyone's happy. A score dragged down means people are quietly suffering.
Read together, these tell a story. Steady throughput plus a rising p99 points to a slow path. Traffic is normal, yet a growing slice of requests is crawling. That combination is the fingerprint of a bottleneck hiding inside a working app.
SLA scores and network latency
A Service Level Agreement (SLA) is the promise your team makes about performance, and a Service Level Objective (SLO) is the internal target you hold yourselves to. The trap is defining those promises on averages. Mature teams don't. As DigitalCosmonot notes, they set targets like "API response time p99 < 800 ms" and calculate error budgets from p99 violations, because a promise built on averages can be technically kept while real users are furious.
Network latency is time lost in transit, out on the wire between the customer's device and your server. A phone on a weak mobile connection or an older device inflates what the person feels even when your backend answered instantly. Last9's PostgreSQL guide gives a clean test: if a trivial single round-trip query consistently takes 100ms+ from the application host, "your database isn't slow, your network is."
This distinction saves you from sending engineers on a wild goose chase. "The app is slow" and "this user's connection is slow" are different problems with different fixes, and confusing them wastes days. The goal of every metric here is the same, to narrow down where the delay actually lives before anyone touches the code.
If you keep hearing "it feels slow" but can't tell whether the problem is your app or the network in between, that's the exact gap application performance monitoring with real-time visibility closes. See what's slowing your checkout down.
Following the slow request down
So you've got a high p99 on checkout. Now what? A percentile tells you that pain exists and roughly how bad it is. To go from "the tail is slow" to "this specific step is slow," you follow the request itself.
The technique is end-to-end transaction tracing, and the idea is plainer than it sounds. A single checkout request rarely does its work in one place. It can hop from your app to a payment API. It may then reach the database through a couple of smaller internal services before the confirmation comes back. Tracing assigns that one request a unique ID and records how long each hop took. As the observability vendor Splunk describes it, distributed tracing follows a transaction as it moves between multiple services, from the user-facing frontend all the way through its journey.
That turns application performance monitoring from a scoreboard into a trail. Instead of a wall of graphs telling you checkout is slow, you get a timeline of one slow checkout, broken down by step, with the seconds attached to each. The Dash0 engineering team frames the payoff well: tracing shows you "where latency accumulates" and which parts of the system sit on the critical path for a given request.
And here's the thing you start to notice once you can read the trail. The slow paths almost always terminate in the same place. Follow enough of them down and they converge, hop after hop, on one particular kind of step. Which brings us to the twist this whole story has been walking toward.
It is almost always the database
The slow request path usually ends at the database because it needs database optimization for a query nobody optimized. That's the recurring culprit. Once you've traced enough slow checkouts, you stop being surprised by it and start suspecting it first.
The database is where your app stores and looks up everything. A query is just a request to fetch or change some of that data. When a query is written carelessly, it can run fine for months and then fall apart without database optimization. Three usual suspects account for most of it.
-
N+1 queries. The app fires one query per record instead of one query for all of them. Fetch ten orders, then fire ten more queries for the customer on each order. According to the guide at PingCAP, this happens most in ORM frameworks with lazy-loading defaults, where related data gets fetched on demand one row at a time.
-
Missing indexes. Without an index, the database has no shortcut, so it scans every row to find what it needs—a database optimization concern. Fine on a small table. Ruinous on a large one.
-
Queries that scale badly. They run instantly on a small dataset and collapse as the data grows without database optimization, which is exactly why a problem shows up "on Tuesdays" or after you gain users.
That last one explains your Tuesday mystery. As the Atatus database guide puts it, a query that takes 50ms with a small dataset can take 30 seconds with production data volumes, and the problem multiplies because concurrent users compete for the same database connections. The same guide notes a query taking 100ms in development with 1,000 rows can take 15 seconds in production with 10 million rows because it never used an index. Your checkout was fine at 3 a.m. and dying at Tuesday's traffic peak because the slow query only revealed itself under load.
The vocabulary of database optimization gives you precise questions to ask. Database optimization makes these queries fast through indexes or query rewrites. It can also fetch related data in one shot instead of a loop. Two terms carry most of the weight in a standup conversation:
-
Slow query logs: a record the database keeps of every query that ran longer than a set time. Ask, "What's in our slow query log for the checkout flow?"
-
Eager loading: the fix for N+1, where the app fetches all the related data up front in one query instead of one per record. The Shift Asia engineering blog calls eager loading the primary solution to N+1 problems, and it relies on an ORM's built-in loading options.
You need to walk in and say: "Under Tuesday load, the p99 on checkout spikes, and the trace points at the database. Can we check the slow query log for an N+1 or a missing index?" That's the difference between a vague worry and a hypothesis your engineers can act on in an hour. The whole chain, from response time symptom to root cause, ends here more often than anywhere else.
Tools that turn data into fixes
Metrics and traces in application performance monitoring tell you what's wrong. The application performance monitoring capabilities turn those raw numbers into a faster fix. Each one catches the Tuesday problem earlier.
Real user monitoring (RUM) watches actual sessions as they happen. It ties a slow page load to a specific person and the conditions they were in. It identifies the mobile network. It also shows whether an old device or browser was involved. As Elastic's guide explains, RUM collects data from actual users interacting with your app. That data gives you the real-world issues they face. This is how you separate "our app is slow" from "this user was on hotel wifi," the exact confusion that sends engineers hunting in the wrong place.
Synthetic monitoring does the opposite. It runs scripted fake checkouts on a schedule, around the clock, whether or not a real customer is shopping. Kentik's comparison describes synthetic as active, scheduled scripted tests that validate performance before real users hit a problem. A synthetic checkout that runs every few minutes on Tuesday catches the slowdown as it builds.
Threshold-based alerts close the loop. Instead of learning about a rising p99 from a support ticket, you set a rule, and the moment checkout response time crosses your line, the team hears about it automatically. The support message stops being your application performance monitoring system.
Together, these application performance monitoring capabilities flag the Tuesday checkout before the customer ever typed a word. Synthetic tests catch it as it builds, and RUM tells you which real users felt it. Alerts wake someone up.
Why teams still miss bottlenecks
So why do problems still slip through when application performance monitoring exists? The answer lies in the frustrations your own engineers voice.
The first is delayed feedback. A slowdown can creep in after a release, and nobody notices until a customer does days later. The second is fragmented tools. Visibility from application performance monitoring gets scattered across separate dashboards, and during an incident, engineers burn time switching between them just to assemble what happened. The third is slow resolution, where every complaint becomes reactive firefighting instead of a clean diagnosis.
The cost is measurable. Apica reports that engineers context-switching across 10 or more fragmented tools see mean time to resolution stretch past four hours, and one of their case studies cut MTTR from 4.5 hours to 72 minutes after moving to a unified view. As the Opstree engineering team puts it, when monitoring data sits across disconnected tools, that context-switching "adds tens of minutes to resolution time, sometimes hours."
A consolidated full-stack view shortens that. One live view of the whole request path means the trace from checkout down to the database sits in one place instead of four. Pollume is one option teams use to get that single view when they'd rather not stitch together separate dashboards. It's a choice, not the moral of this story. The method matters more than any application performance monitoring tool, and you can run the method with whatever gives you percentiles and traces.
Your bottleneck checklist
You now have the sequence to run yourself before pulling in an engineer. It's the same backward trace, turned into steps:
-
Start from the complaint. Take the vague "checkout feels slow on Tuesdays" seriously and pin it to a flow.
-
Check the p95 and p99 on that path, never the average. The tail is where the pain hides.
-
Trace the slow request. Follow one slow checkout hop by hop to find which step ate the seconds.
-
Suspect the database first. Ask about the slow query log and whether the query shows an N+1 pattern or a missing index.
And here's how to tell your team is using application performance monitoring without ever finding the bottleneck. Watch for these red flags:
-
They report only averages and never percentiles.
-
They watch only up-or-down status.
-
They learn about slowness from customers instead of alerts.
-
They have no way to trace a single request end to end.
Bring this checklist to your next standup. You have the vocabulary and the sequence to ask sharper questions, and when you want one live view of the whole path from symptom to slow query, application performance monitoring gives you exactly that. Check your slow queries first.